Consent Trends and Pageviews Reports
Last updated on December 30, 2025
Overview
The Reports page provides insights into how visitors interact with the cookie consent banner on your website. Use this dashboard to track total consents, user preferences and pageview usage based on your current plan. These insights help you monitor consent trends and stay compliant with data privacy regulations.
How to Access Consent Trends and Pageviews Reports?
- Log in to your CookieYes dashboard.
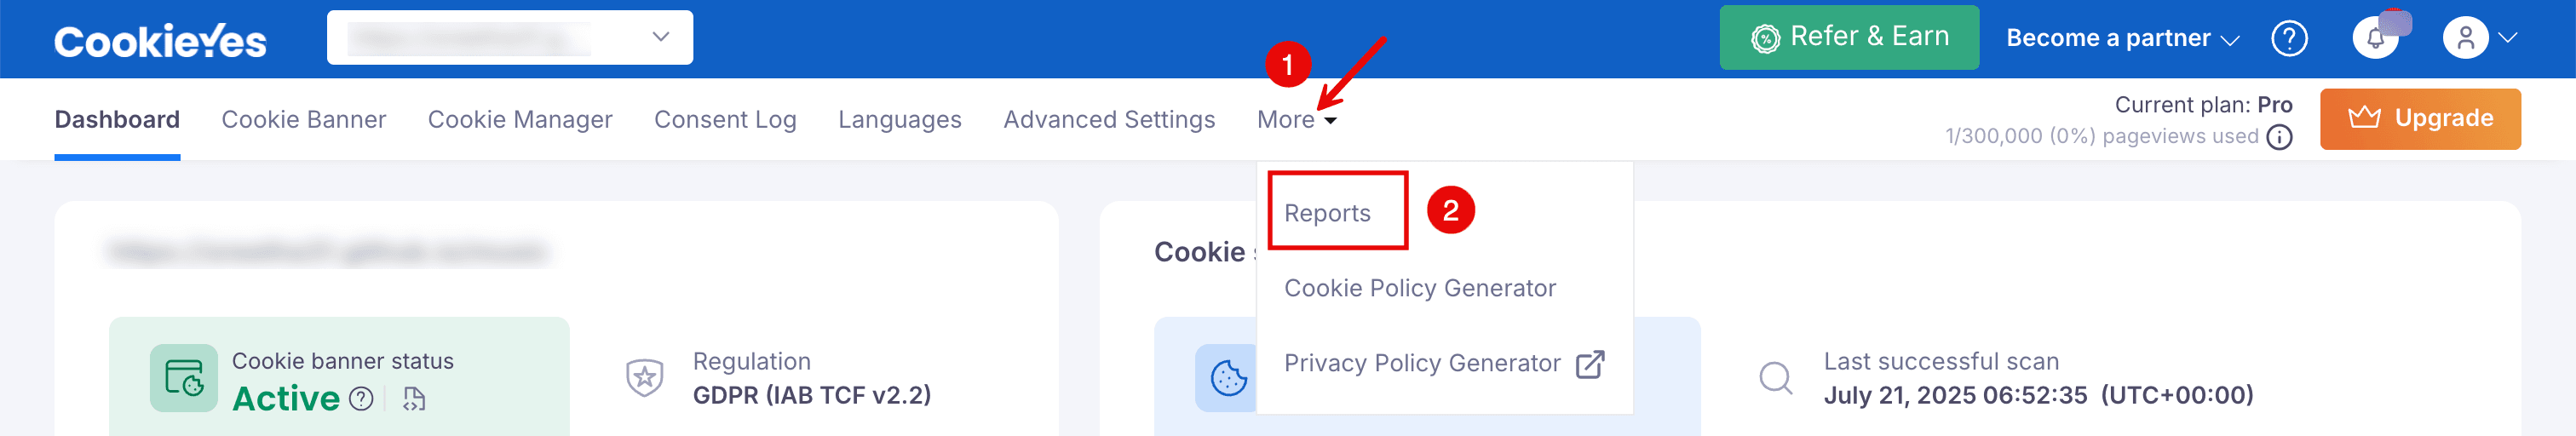
- From the top navigation bar, go to More > Reports.
- Reports are displayed based on the default date range (Last 7 days). To change it, open the date-range dropdown and pick a different range (for example: Last 30 days, This month, or All time).
Report Overview Sections
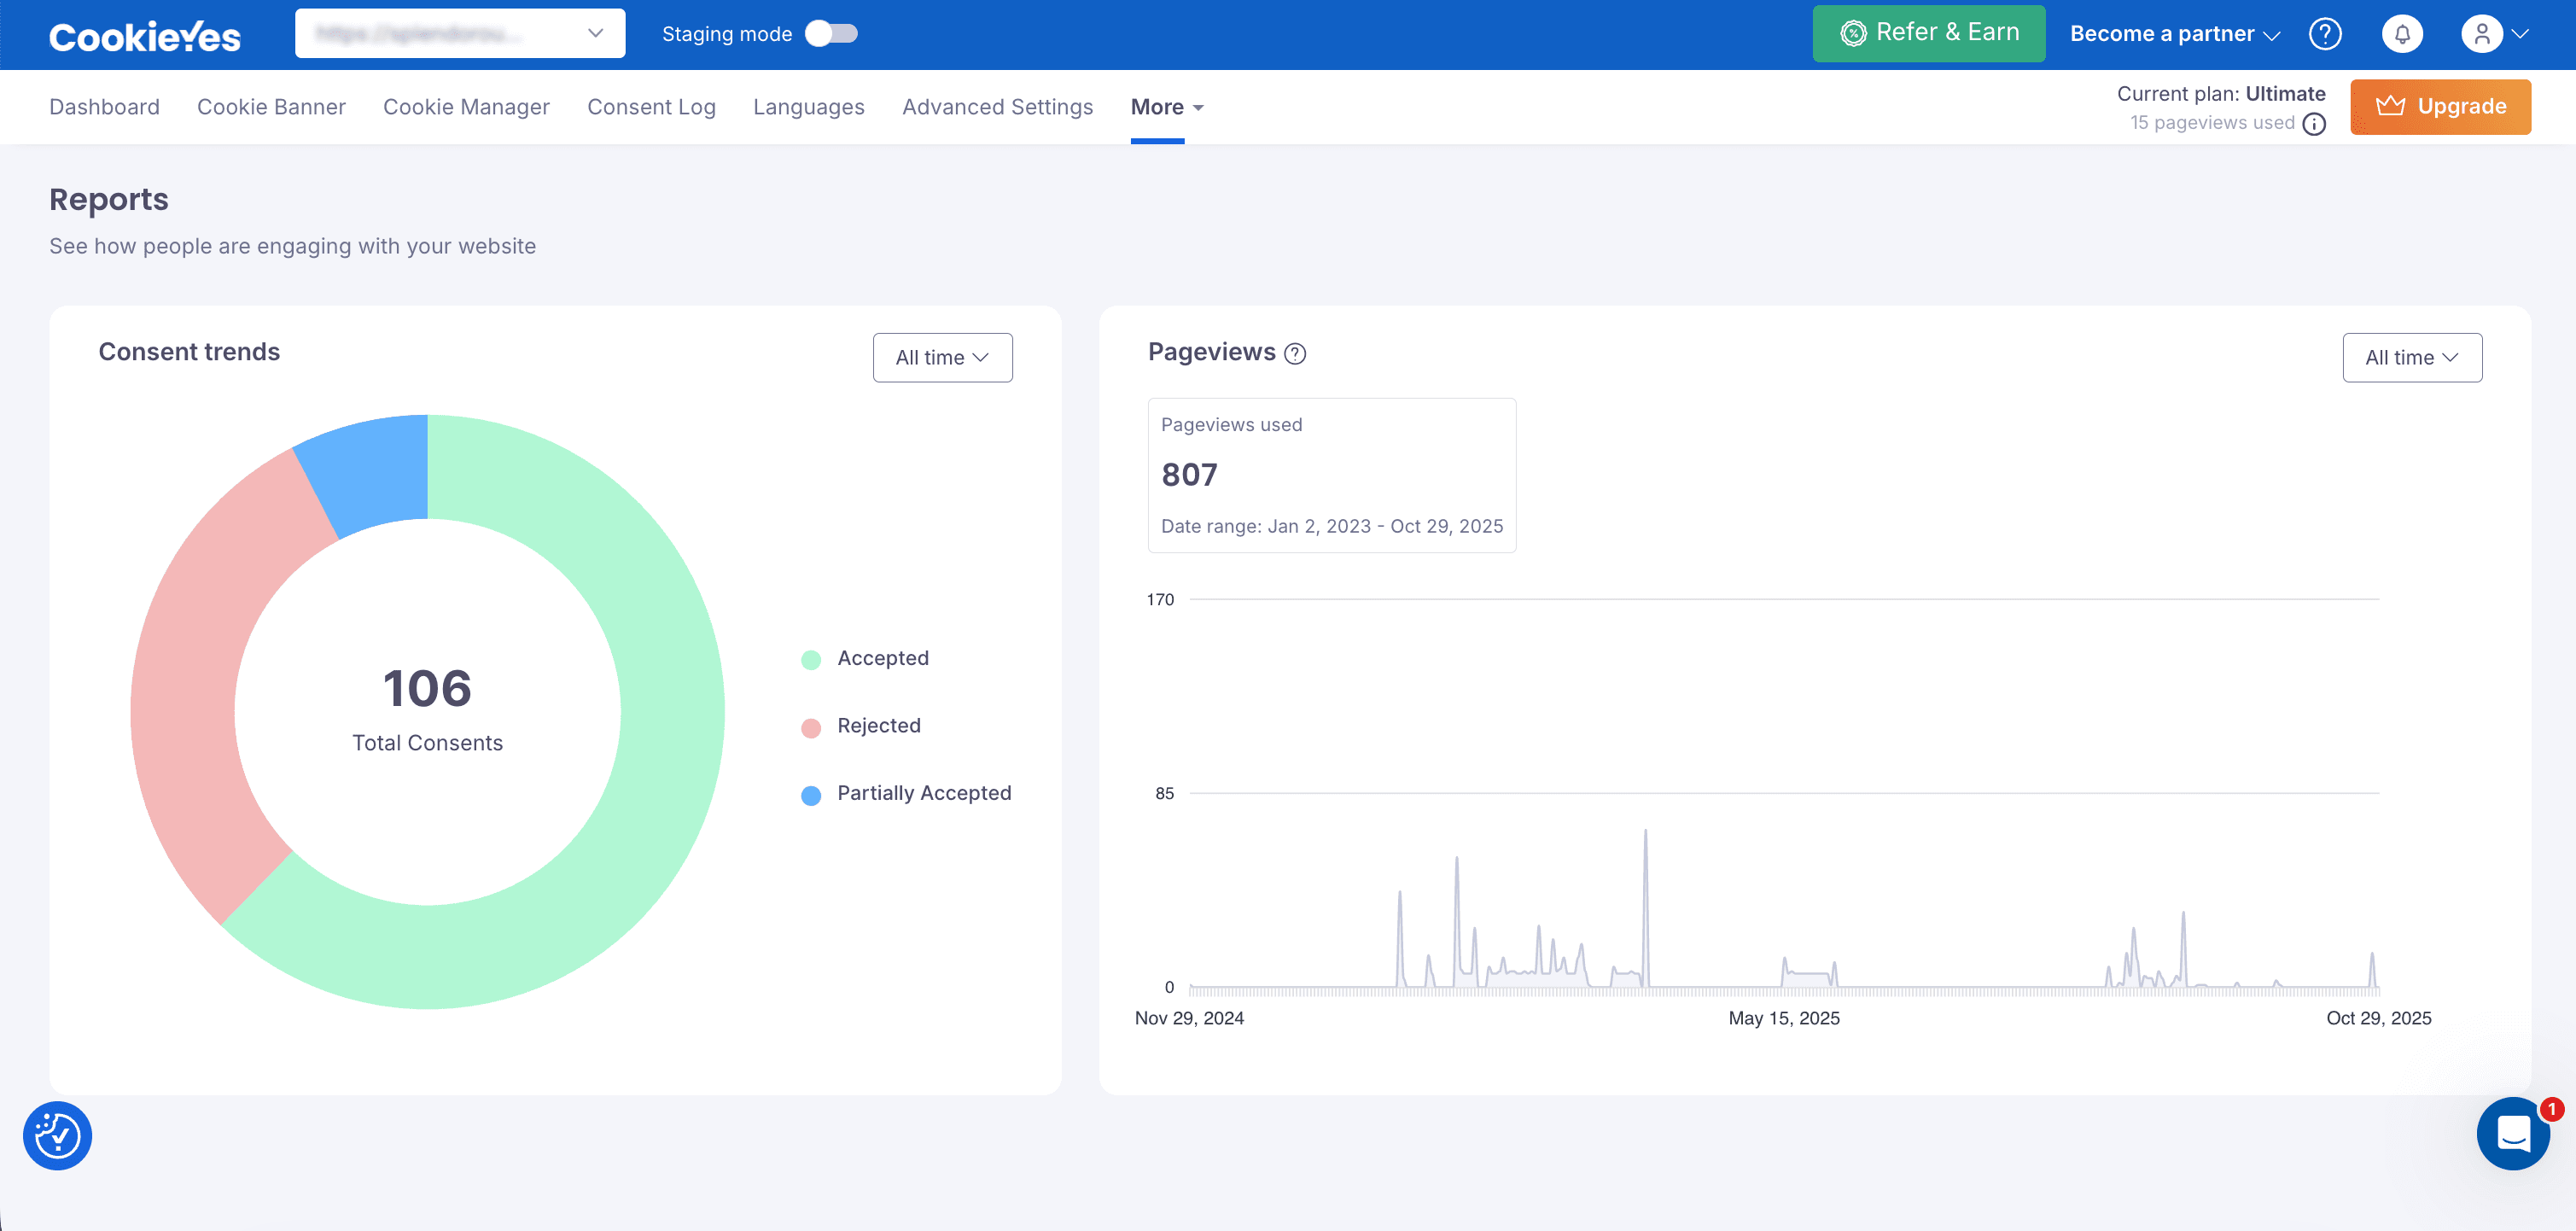
The Reports Overview includes two sections: Consent Trends and Pageviews. Together, they show how users interact with your cookie banner and how your website’s traffic performs.
- The Consent Trends section focuses on how visitors respond to your cookie consent banner, helping you understand user preferences and engagement.
- The Pageviews section tracks your website’s total traffic and monitors how much of it counts toward your monthly plan usage.
By default, reports display data for the last 7 days, but you can adjust the date range using the dropdown filter (for example: Last 30 days, This month or All time). Changing the date range updates both sections instantly, allowing you to analyse patterns and compare performance over time.
Consent Trends
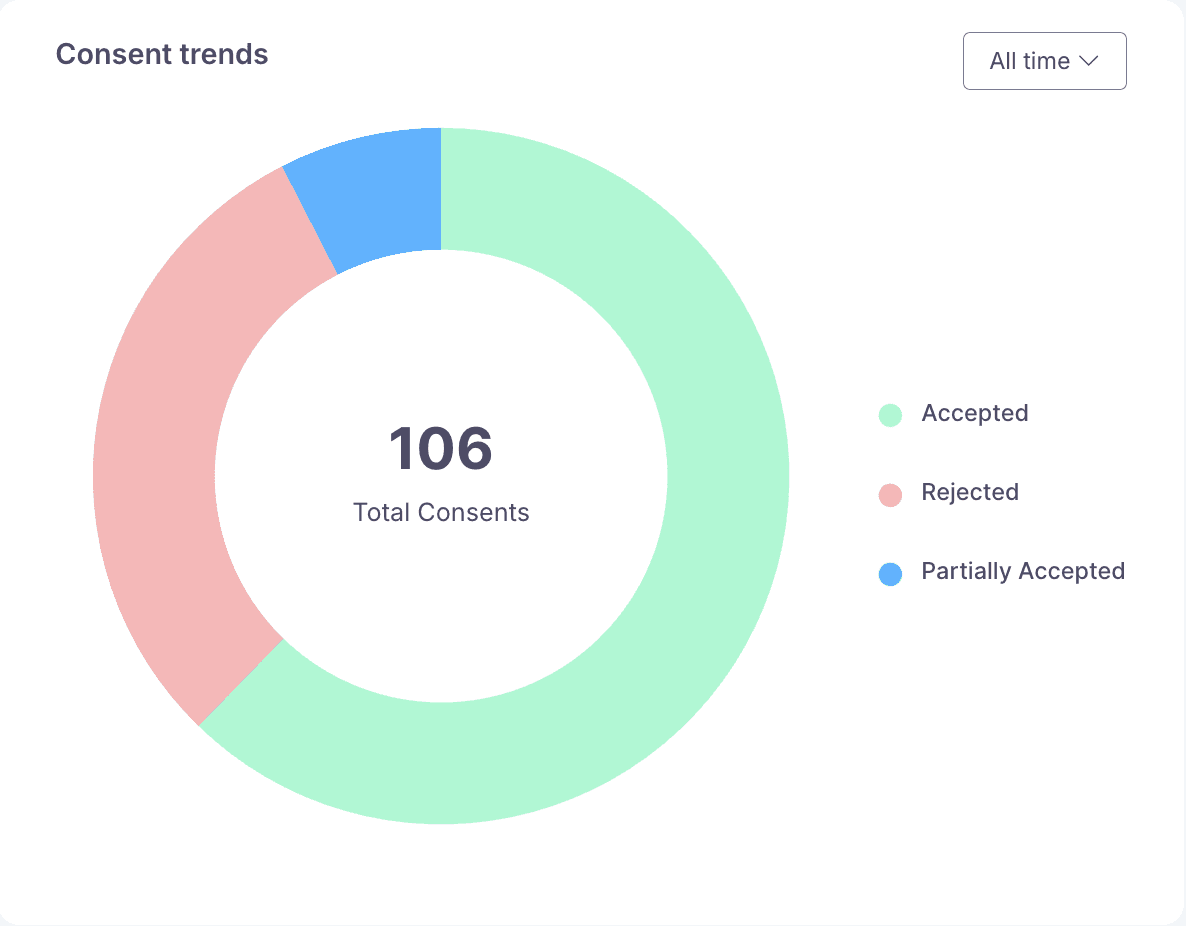
The Consent Trends section provides a visual summary of how visitors respond to your cookie consent banner. It highlights user privacy and consent preferences, enabling you to evaluate banner performance and make compliance decisions. This section displays a donut chart with the total number of consent interactions for the selected date range. Each segment in the chart represents a type of user response:
| Consent Type | Description | When It Happens |
|---|---|---|
| Accepted | Users accepted all cookies or the required categories. | When a visitor clicks Accept All or agrees to required cookies. |
| Rejected | Users decline the use of cookies. | When a visitor clicks Reject All or dismisses tracking. |
| Partially Accepted | Users selectively allow certain cookie categories. | When a visitor opts in only to Functional, Analytics, or Advertising cookies. |
| Total Consents | Total number of recorded responses from the banner. | Count of all consent interactions for the selected date range. |
By reviewing Accepted, Rejected, and Partially Accepted responses, you can see how visitors engage with your banner.
- A high number of Accepted responses often indicates user trust and clarity in your messaging.
- A high number of Rejected responses may suggest that the banner feels unclear, intrusive or lacks sufficient information.
- Partially Accepted responses show that visitors are selectively choosing categories, reflecting increased awareness and control over their privacy.
These insights help you assess how effectively your banner communicates consent choices. You can use the data to support compliance with regulations like GDPR and CCPA, refine banner design and messaging and improve user engagement. Analysing consent trends ultimately builds trust by giving users transparency and control over their data.
Pageviews
The Pageviews section provides an overview of the total number of pages viewed on your website within the selected date range. It includes all recorded pageviews tracked by CookieYes during that period, helping you understand your website’s traffic patterns and banner visibility. This count includes both pageviews within your current subscription plan and any additional traffic that exceeds your plan’s monthly limit.
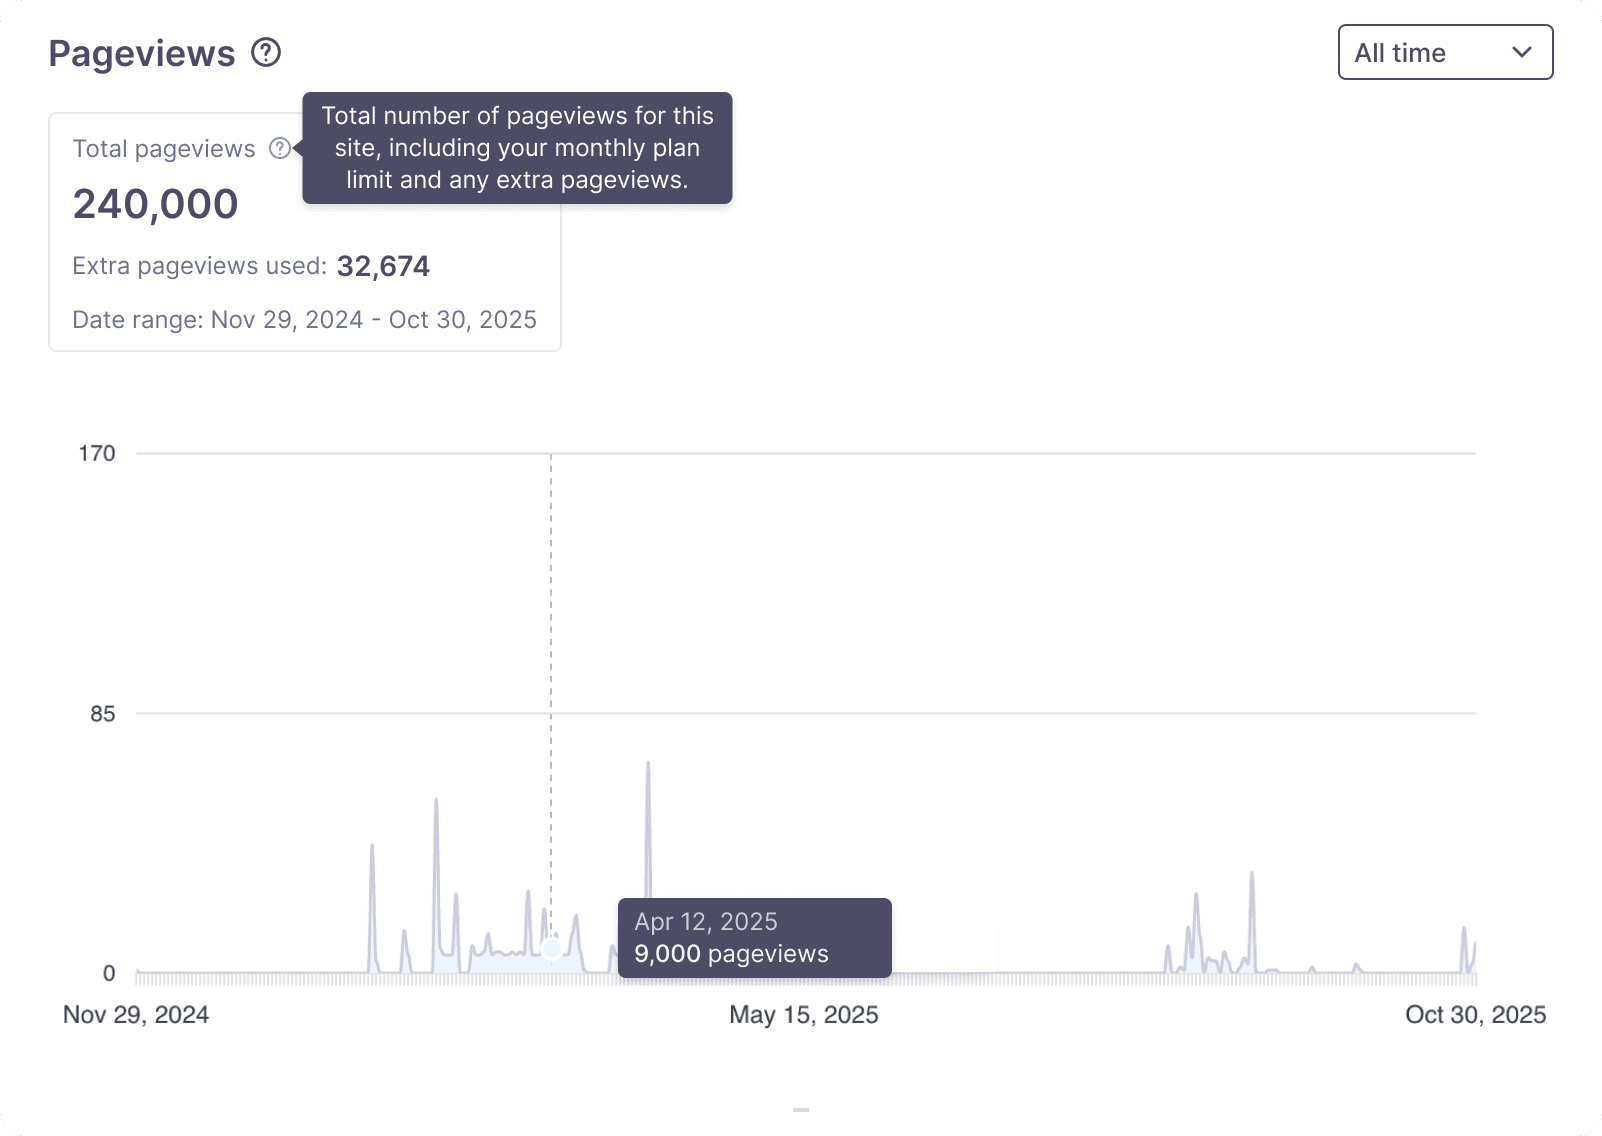
In the example shown above, a total of 240,000 pageviews were recorded between November 29, 2024 and October 30, 2025. These pageviews are captured each time a visitor loads a page containing the CookieYes script. The line graph below visualises how traffic fluctuates over time, showing periods of low activity and occasional spikes on specific dates.
When your traffic exceeds the monthly plan limit, the additional pageviews are reflected in the summary card above the chart. The Extra pageviews used value helps you track usage beyond your plan allowance, while the graph itself shows overall traffic trends for the selected period.
Extra pageviews behaviour is determined by your account creation date.
- New users (signing up after July 2025): Extra Pageviews is enabled by default. Any pageviews beyond your monthly limit are automatically billed at $0.0003 per 1,000 extra pageviews.
- Existing users (signed up before July 2025): Extra pageviews remains optional. You can enable it anytime from Billing & Invoices > Extra Usage. Billing applies only when the feature is enabled.
Extra pageviews is available for all Basic and Pro plans. The Ultimate plan includes unlimited pageviews, so additional usage does not apply. For more details, see the Pageview Pricing guide.
Regularly monitoring this section helps you anticipate extra pageview charges, manage your website’s traffic usage and decide when to upgrade your plan.
Conclusion
The Reports page helps you monitor both cookie consent activity and website traffic in one place. By reviewing Consent Trends, you can gauge how effectively your banner communicates privacy choices to users. The Pageviews report, on the other hand, helps you track traffic usage against your plan limits and manage additional costs proactively. Regularly reviewing these reports ensures your website remains compliant, transparent and optimised for user trust.